
Growth
kurasushi.com against its category
The biggest tracked US Japanese & Korean chains by card spend, with year-over-year growth of category share. Share means a chain's slice of tracked category spend. It can decline while the chain's own sales grow. The chart tracks kurasushi.com's share of the category quarter by quarter, indexed to 2024 Q4 = 100.
| # | Chain | YoY share |
|---|---|---|
| 1 | KPOT Korean BBQ & Hot Pot | +13.5% |
| 2 | Benihana | -1.2% |
| 3 | Sarku Japan | -7.4% |
| 4 | Sakura | -0.3% |
| 5 | Kobe Japanese Steakhouse | -5.6% |
| 6 | kurasushi.com | - |
| 7 | Bonchon Chicken | -7.1% |
| 8 | Sakura Japanese Steakhouse | -7.1% |
| 9 | Yamato Japanese Steakhouse | +6.7% |
| 10 | Yummy Bowl | +6.3% |


Share of tracked category spend, indexed
Store footprint
Store map
74 tracked kurasushi.com locations across 21 US states and DC. California, Texas, and New Jersey hold 53% of them.
Tracked stores by state
- California 20
- Texas 13
- New Jersey 6
- Illinois 4
- New York 4
- Florida 3
- Georgia 3
- Massachusetts 3
- Arizona 2
- Michigan 2
- Pennsylvania 2
- Washington 2
- Colorado 1
- District of Columbia 1
- Indiana 1
- Maryland 1
- Minnesota 1
- Missouri 1
- Nevada 1
- Ohio 1
- Oregon 1
- Virginia 1
Customer overlap
Who shops at kurasushi.com
Tracked chains kurasushi.com customers also buy from more than a similarly active shopper would, indexed to the strongest overlap (100). From real card transactions.


In the app
Go deeper on kurasushi.com
This page publishes rankings and relative growth. The app answers the questions behind them, from the same transactions. Free for 14 days, no card needed.
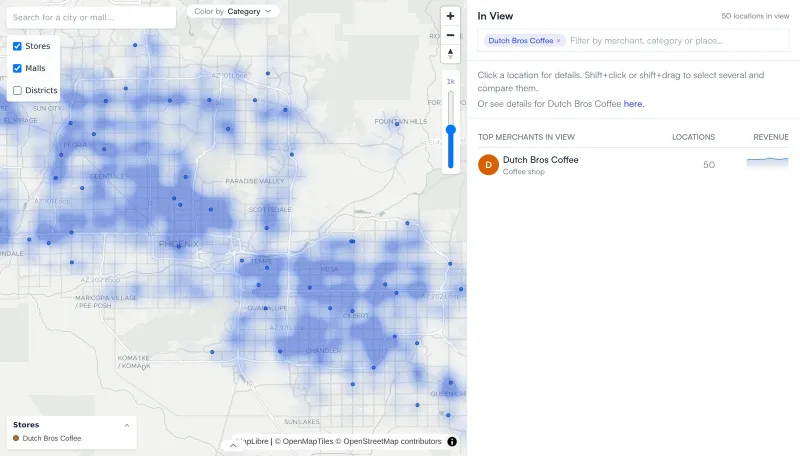 Example: Dutch Bros Coffee in Phoenix
Where do kurasushi.com customers live?
Catchment maps built from where customers live and spend, for every store and every competitor around it.
Start free trial →
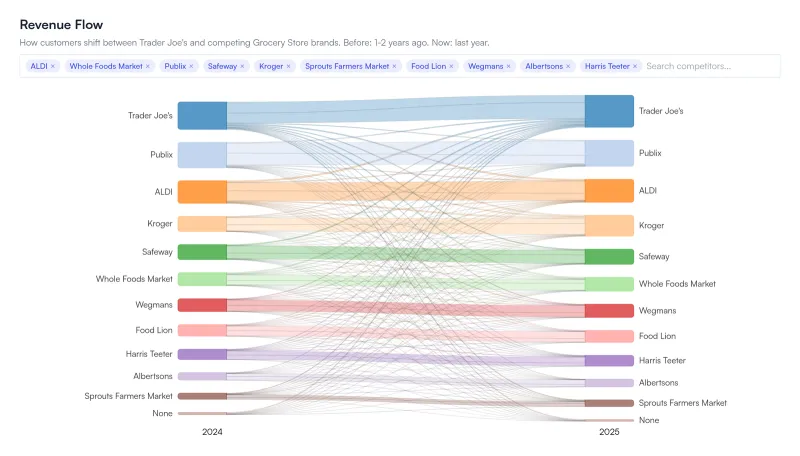 Example: Trader Joe's and other grocers
Who is winning kurasushi.com customers?
Follow spend as it moves from brand to brand, year over year: who customers left, and where they went.
Start free trial →
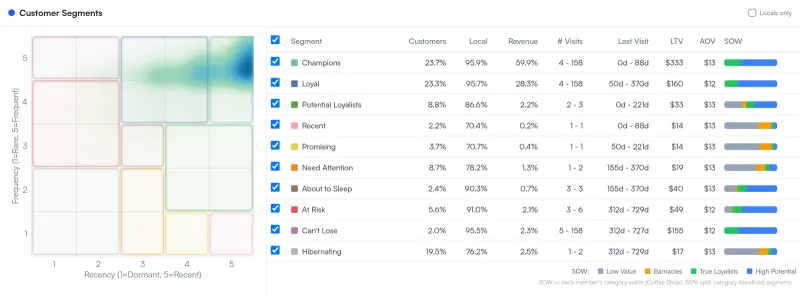 Example: Starbucks
Which customers carry kurasushi.com?
Champions, loyal, at risk: behavioural segments with retention, frequency and share of wallet for each.
Start free trial →
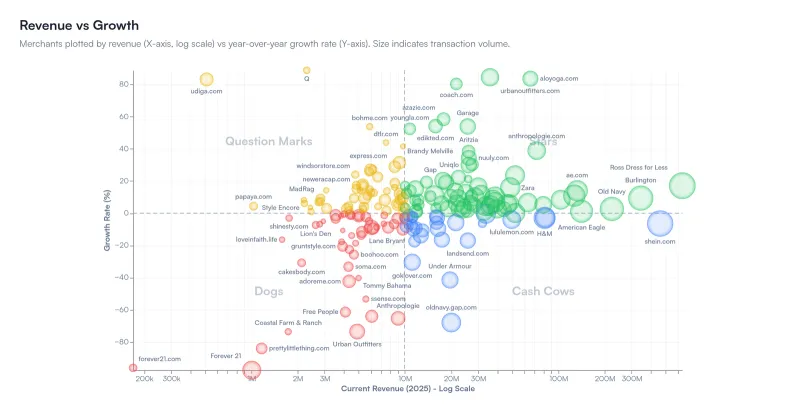 Example: US clothing stores
How big is the category, and who made its growth?
Size, growth, concentration and seasonality of a category across the country, with every brand plotted by spend and growth.
Start free trial →
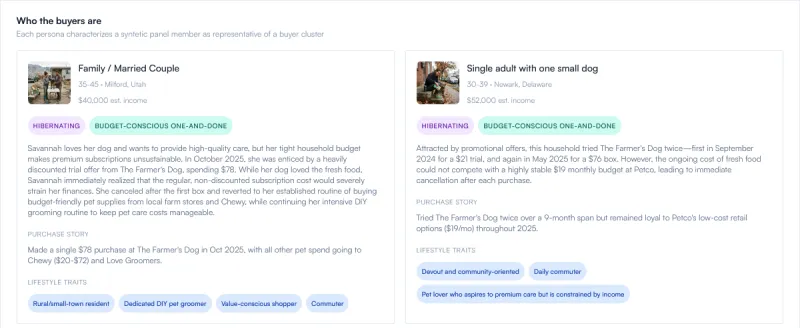 Example personas
Talk to kurasushi.com customers
AI personas built from real purchase histories. Interview them, or send a questionnaire and read the answers the next morning.
Start free trial → Professional plan
Sample question
“Which competitor gained the most from customers who left kurasushi.com?”
Ask Claude or ChatGPT about kurasushi.com
Iceflower connects to Claude and ChatGPT on every plan. Ask in plain language and get the answer from the panel.
Start free trial →
Need the data itself? API access, data feeds and malls & places analytics are part of the Enterprise plan. Talk to us
More trends