fashion, apparel & footwear
See where fashion spend really goes
Iceflower resolves real card and bank transactions from more than 130 million US and EU consumers to every apparel merchant, store and channel. Benchmark your market. See which customer groups switch, and to whom. Find the markets with growth left in them. Measure what changed after you acted.
Trial runs on the real product with real data. No credit card. Plans from $990 per month.
who this is for
Who uses Iceflower in fashion, apparel and footwear
Each team gets the answer to its question, makes the move, and proves it worked.
brands
Apparel & footwear brands
consumer & market insights · DTC and channel leads · brand strategy
which retail channels are our buyers shifting toward, and at whose expense?
- Benchmark your owned retail and DTC against the whole category
- Watch the health of your wholesale doors, from real spend
- Size white space by metro before committing stores or media
retail
Vertical & specialty retailers
strategy & insights · real estate & expansion · performance marketing
who is taking our customers, and which trade areas do we defend first?
- Location-level benchmarks against every competitor that matters
- Catchments and overlap for the network you run and the one you plan
- Retention and share of wallet beyond your loyalty base
off-price
Off-price & value fashion
merchandising & planning · site selection · marketing
how much of the treasure hunt is drifting to online value players?
- Benchmark the banner against full price and online value players
- Quantify the online value overlap per buyer, not per anecdote
- Spot which trade areas the value customer is moving into
01 · understand
See who you are really up against
Every apparel and footwear merchant, store and channel, benchmarked from real purchases. Not surveys, not foot traffic. The panel sees the card, so stores, e-commerce and marketplaces sit in one omnichannel dataset.
decisions this step settles: who belongs in the competitive set · which losses to fight · which customers to defend
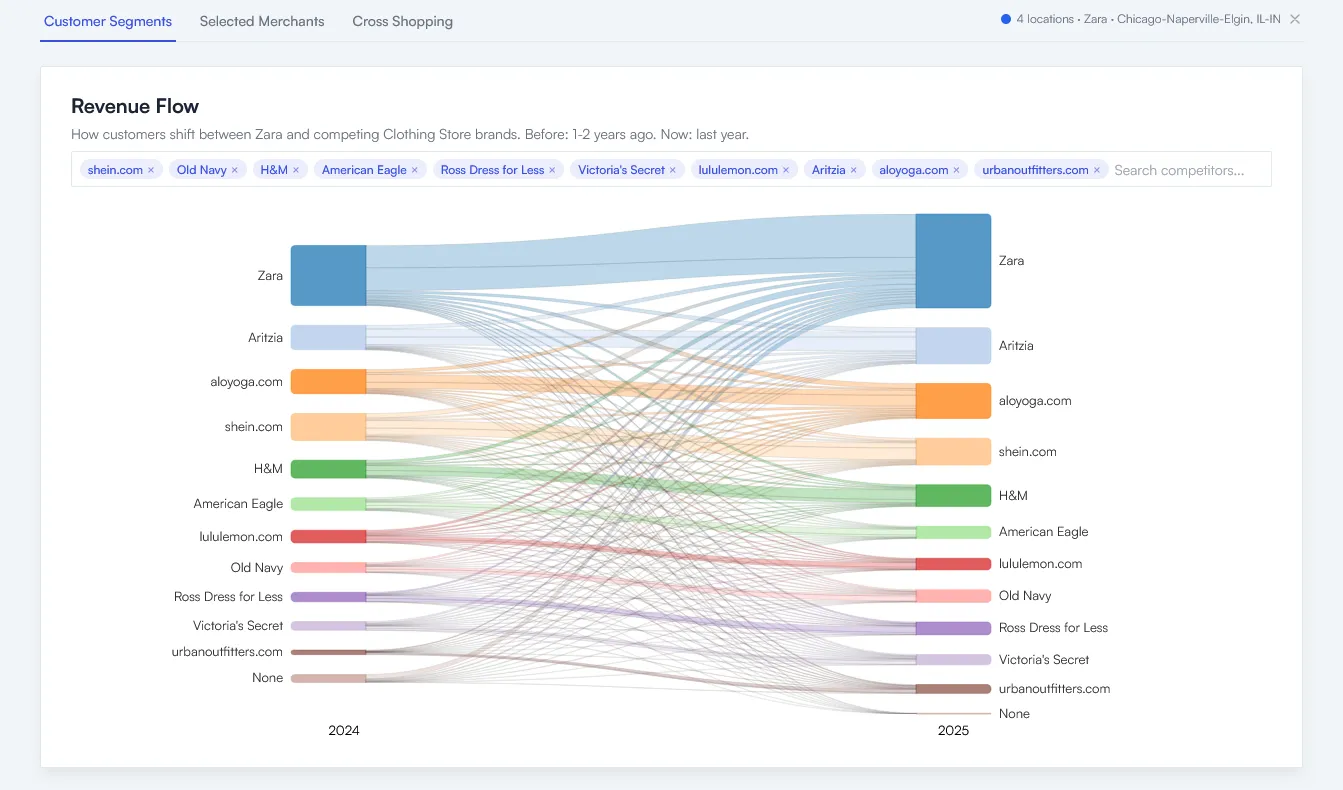
Pick the benchmark that matters
Revenue, growth, basket and customers for every banner and store in your trade areas, national chain to local challenger. Decide who you are competing with before deciding anything else.
See switching before it becomes churn
Cross-shopping and share of wallet per buyer: the off-price treasure hunt, the marketplace drift, the competitor two doors down. The overlap loyalty data never shows.
Churn with a destination
Lapsed customers do not disappear, they spend somewhere else. Iceflower names the somewhere else and what it now earns from them. 43.7% of Macy’s shoppers also bought at T.J.Maxx, at $271 per buyer, in the 12 months to Jul 2026.
Know which customers are worth defending
Champions to At Risk with lifetime value and share of wallet, plus the catchment each store actually draws from. Defense budgets go where the value is, not where the noise is.
Sample question we answer
“How big is US off-price really, who is gaining share, and where do our stores draw from?”
02 · activate
Turn the finding into the next move
The segment you just discovered is not a slide. It is an audience, a campaign brief, a store location or an acquisition case.
decisions this step settles: which audience gets budget · where to grow next, organic or acquired · what to test before committing
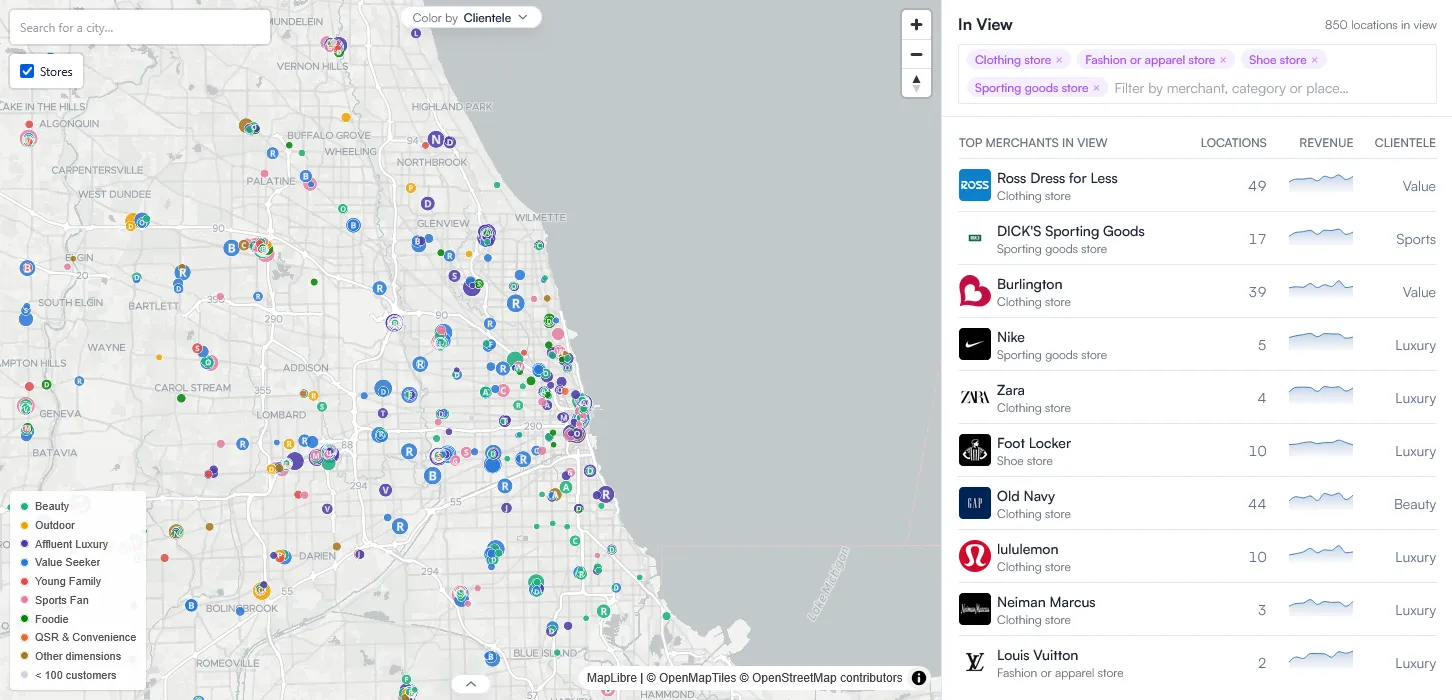
Put budget on the segment you found
Turn any segment into a derived audience for paid social, retail media, CRM or any other channel. No raw data leaves the panel. The insight and the campaign stop being two separate documents.
Ask your market overnight
Chat with AI personas built for each merchant’s customer segments from real spending behaviour, or field a questionnaire to your segment and read the results in the morning.
Grow where demand is arriving
Size white space by metro, online and offline. The same map places your next store, aims a regional campaign, or screens an acquisition whose customers you would actually keep.
Sample question we answer
“Which three metros should get our next stores, and how do we reach lapsed buyers there?”
03 · measure
Did it work?
The same panel that found the opportunity measures the response, continuously and against a baseline. Keep, scale or stop, on evidence.
decisions this step settles: keep, scale or stop · what to report as incremental · when to intervene
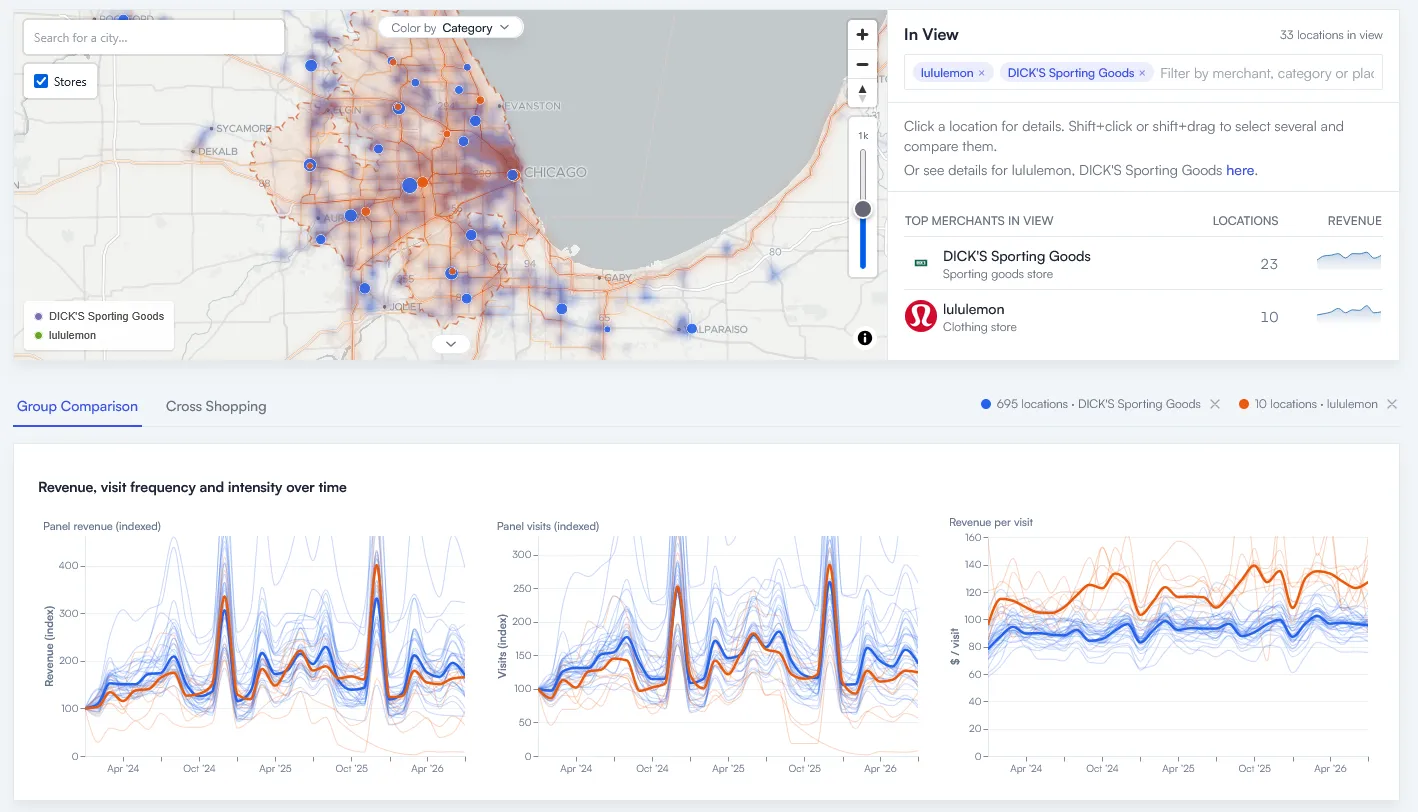
Before and after, with a control
Compare a launch, remodel or campaign window against matched stores or the whole category, not against last year’s weather.
Customers, not just revenue
See whether growth came from new buyers, higher frequency or bigger baskets, and which clientele actually responded.
Always current
The panel updates continuously, so a marketplace surge or a competitor’s slide shows up while it is happening, not two quarters later.
Sample question we answer
“Our outlet push started in March. What did it do to our full-price customers by June?”
questions this page answers
What apparel and footwear teams ask, answered from the panel
Which competitors are taking my customers, and where did they go?
Iceflower follows lapsed customers of any banner to the merchants where they now spend, with the amount. The overlap shows before they lapse: 43.7% of Macy’s shoppers also bought at T.J.Maxx, at $271 per buyer, in the 12 months to Jul 2026.
How do I measure cross-shopping between full price, off-price and marketplaces?
The panel sees the card, so a store purchase, a marketplace order and an off-price basket from the same household sit in one dataset. Cross-shopping and share of wallet are computed per buyer for any banner against any competitor, including shein.com and Temu.
Where should an apparel brand open its next stores?
Explore colors every apparel store in a metro by the clientele it actually draws and shows the catchment of every existing door, yours and competitors’. Candidate sites are evaluated against proven spend of the right customers, not traffic counts.
What is the difference between transaction data and foot traffic or survey data for apparel?
Foot traffic counts bodies and surveys record intentions. Transaction data records what was paid, where, and by which household group. Iceflower benchmarks revenue, basket, customers and switching for every merchant, store and channel from real purchases.
Did our outlet push cannibalize full-price customers?
Group Comparison puts two sets of stores side by side and tracks revenue, visit frequency and spend per visit over time, store by store. The window is compared against matched stores or the whole category, not against last year’s weather.
ai agents
Tired of dashboards? Skip ours.
Iceflower runs as a connector in Claude and ChatGPT, live and approved in both directories. Connect once and ask in plain language. The dashboard stays there for the day you want to validate a number.
who is gaining share in apparel and footwear this year?
where do our customers churn to?
where do our competitors’ customers also spend?
which regions are growing for off-price?
Answers grounded in real transactions, in the assistant your team already uses.
pricing
Straight prices, no surprises
Explore
Apparel in your market, in full depth.
- For a single team
- One category in one US state, UK region or metro area
- AI / MCP agent access
- 14-day free trial
Professional
Apparel plus the categories your customers cross-shop, nationwide.
- For your whole organization
- Everything in Explore
- Up to three categories, up to a whole country
- AI personas, chats & questionnaires
- AI reports
- 14-day free trial
Enterprise
Full access, built around you.
- For your company and its systems
- Everything in Professional
- API and data feeds
- Your own live bespoke workspace, updated continuously
- Malls & places analytics
Prices exclude taxes. Trials do not require a credit card.
faq
The questions a seasoned buyer asks first
The short version below. Please reach out in case of further questions.
- What data sits behind the apparel view?
- Real card and bank transactions from a panel of more than 130 million US and EU consumers, resolved to named merchants and stores. Benchmarks, cross-shopping and catchments are computed from actual purchases, not surveys or modeled estimates.
- Are the numbers on this page real?
- Yes. Every figure was pulled from the live panel in August 2026, with its merchant and time window stated next to it. Rerun them in a trial account and you should see the same numbers, moved by as much as the market has moved since.
- Does it cover online and marketplaces, or only stores?
- Both, in one dataset. The panel sees the card, so store spend, e-commerce and marketplaces such as Shein and Temu appear side by side, and channel shift becomes measurable per customer group.
- Is the data SKU-level?
- No. Iceflower is merchant-level: spend, customers, baskets and locations per banner and store. That is the level where category, channel and location questions are decided. Product-level questions inside your own assortment stay with your own systems.
- Can I see my own brand next to competitors?
- Yes. Your banner appears in the same benchmarks as everyone else's, computed from the same panel, so the comparison is symmetric and needs no data sharing from your side.
- The cards say per month. Is that what the invoice says?
- Yes. Plans are billed monthly, and prices exclude taxes. What the card says is what the invoice says.
- How do I start?
- Create an account. The 14-day trial runs on the real product with real data. When you subscribe, choose Retail as your category for your region.
Ready to see your category clearly?
Create an account and rerun every number on this page against your own market. Fourteen days is enough to know.